
As we move into the weekend, the memecoin side of the crypto market is in a tricky spot. The king of memecoins, Dogecoin (DOGE-USD), is a perfect example of how tricky its current price action situation is. From a technical analysis perspective, DOGE’s technical indicators provide strong evidence for a bullish breakout or a move back to bearish price action.
The Bullish Case: Climbing the Fibonacci Ladder
Dogecoin has held its ground at the critical 61.8% Fibonacci retracement level at $0.1232, signaling a strong support zone that could form a strong base if it holds. The next challenge for Dogecoin is the 50% Fibonacci level at $0.1387, which, if conquered, could validate bullish sentiments further. The RSI underlines this potential, currently plotting just below 35 and hinting at a breakout from a descending triangle—a classic bullish signal in technical analysis.
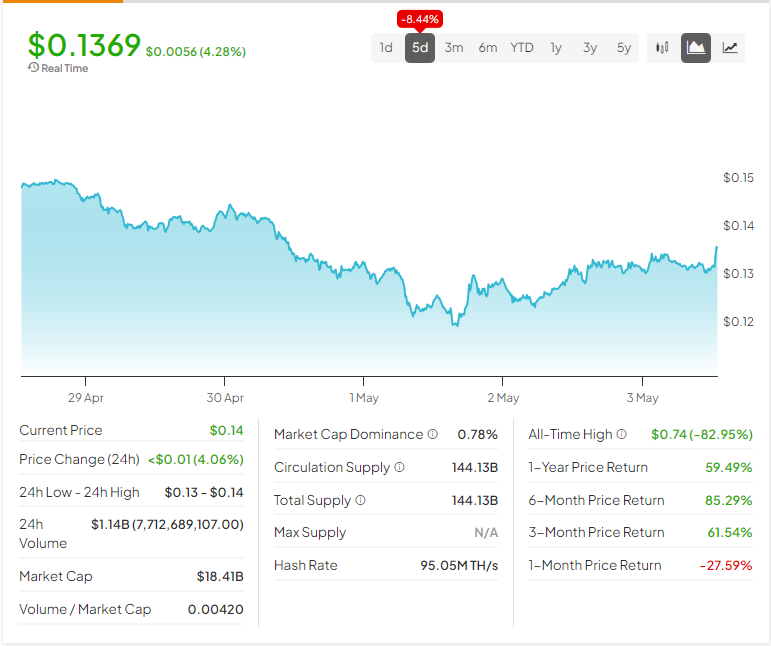
TipRanks’ latest data bolsters this optimism, with Dogecoin’s daily 20-period EMA at $0.10 and 50-period EMA at $0.10, both showing a strong Buy signal, as they sit below the current price of $0.1369. Similarly, on the weekly chart
The Bearish Case: Warning Signs on the Road
However, the road isn’t free of obstacles. Both long and short-term analyses from TipRanks paint a more cautionary tale. On the monthly chart, the 20-period and 50-period EMAs are both parked at $0.1400, suggesting a Sell signal. Additionally, the 3-day chart shows the 20-period EMA at $0.1500 and the 50-period EMA at $0.1300, both also indicating Sell signals, further complicating the bullish forecast.
If you’re looking for a clear bullish or bearish narrative going into the weekend, there isn’t one. Sometimes, the only clear direction is that there isn’t one.
Don’t let crypto give you a run for your money. Track coin prices here
